


From Corner to Shot: A Logistic Regression Analysis

I recently analysed corners in the Big 5 European Leagues’ 2017/18 season as part of a project for a football analytics course I’m currently taking. Here are my findings.
Methodology
I set out to determine which corners are most dangerous and, in turn, which players produce the most dangerous corners. I defined a dangerous corner as one that resulted in at least one shot within 8 seconds of the corner being taken.
I hypothesised that several factors might influence whether a shot occurs within 8 seconds of a corner. These include:
Accuracy: In the dataset, a corner was considered accurate if a teammate was the first to touch the ball after the corner was taken. Retaining the ball seemed like a good indicator of whether the team would get a shot off.
Opposition Goalkeeper Height: The rationale here is that taller goalkeepers may be more dominant in claiming or clearing balls, thereby preventing shots.
Corner Height: In the dataset, corners were labeled as either high or low (all short corners are low). I hypothesised that a higher corner would be easier to attack and therefore more likely to result in a shot.
Corner Side: Whether the corner was taken from the left or right.
Swing Type: Using a combination of the corner side and the corner taker's dominant foot, I determined whether the corner was in-swinging or out-swinging.
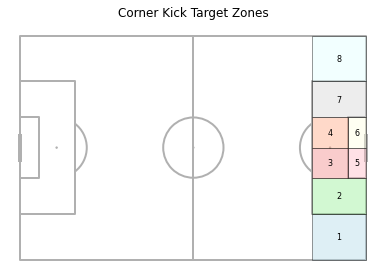
End Position of Corner: I divided the penalty box and the surrounding area into 8 zones, as shown in the graphic below. Anything ending outside of these zones was grouped into an additional "Outside" zone. I hypothesised that certain zones increase the likelihood of a shot.
I trained the model on Premier League data, and the graphic below shows the location of corners that led to a shot within 8 seconds in the 2017/18 season.

Model Outcome
I used a logistic regression model, which applies to binary data, to predict the likelihood of a shot based on the factors outlined above. This model helps us understand how likely a shot is given certain conditions and provides a percentage chance instead of a simple yes or no. Logistic regression offers clear, probability-based predictions that are easy to interpret and act upon.
Each feature in the model (like accuracy or corner height) is tested to see if it has a meaningful impact on the likelihood of a shot. The p-value is a measure of whether the impact of a feature is likely real or due to chance. A p-value below 0.05 suggests there’s less than a 5% chance that the feature’s impact is due to random chance, so we consider it statistically significant. If the p-value is over 0.05, it suggests the feature may not have a meaningful impact and could simply add noise to the model.
When I first ran the model, several features had a p-value over 0.05: corner height, opposition goalkeeper height, swing type, and corner side. I removed these features in my final model to keep only the factors with meaningful contributions.
The final model had a negative intercept (-3.63), indicating that without the influence of other factors, the likelihood of a corner leading to a shot is quite low.
Key Findings:
Zones 3, 4, 5, and 6 all had p-values close to 0, with coefficients as follows: Zone 3 (1.35), Zone 4 (1.43), Zone 5 (1.16), and Zone 6 (1.23). Targeting these zones—covering the area up to the edge of the penalty box and the width of the goal—increases the likelihood of a shot, with Zones 3 and 4 having the greatest impact.
Accuracy (coefficient: 1.71) in corner delivery has a significant positive effect on shot probability. Accurate corners are associated with a much higher likelihood of a shot, confirmed by a very low p-value (0.000).
Best Players
Among players who took at least 10 corners in the 2017/18 season, the six with the highest shot probability from their corner deliveries were Admir Mehmedi (Bayer Leverkusen), Jonas Hofmann (Borussia Mönchengladbach), Jonathan Schmid (FC Augsburg), Matt Phillips (West Brom), Pascal Groß (Brighton), and Yohan Cabaye (Crystal Palace). The plots below show where each player's corners ended in the 2017/18 season.

The number of goals from shots taken after these players' corners were: Phillips and Groß - 3, Hofmann - 2, Schmid - 1, and Mehmedi and Cuisance - 0.
Final thoughts
Considering this model’s outcomes in a scouting capacity, I would not recommend signing any of the players identified as top corner takers based solely on this analysis. However, this model offers valuable insights into what makes corners more dangerous. Specifically, it highlights the importance of targeting certain areas within the penalty box and ensuring teammates successfully connect with deliveries.
I would like to enhance this model by incorporating additional data, such as the number of players in the box and the goalkeeper’s positioning, to further refine the understanding of what influences shot likelihood.
Stay tuned for more in-depth analyses and insights into the beautiful game!
Data source: Wyscout